
What's the first thing you do after obtaining elevated privileges on an organization's network? Look for the gold – the valuable data!
While there are a lot of tools and methodologies that support obtaining elevated privileges during a penetration test, there is still a lot of room for tools that assist with looking for valuable data once this level of access is obtained. In this blog post, I'd like to discuss Leprechaun, a new tool to assist with post-exploitation.
Why Leprechaun?
During many of my penetration test engagements, it's usually a matter of time until obtaining at least some level of elevated privileges, allowing me to enumerate systems and services within the internal environment. One of my personal favorite tools to use is Bloodhound, which helps you quickly identify privilege escalation paths and it works great. However, during a black box penetration test, we're not aware of what the network actually looks like and need to conduct as much reconnaissance as possible to build out a network diagram, identify valuable servers and resources, map out data points, etc. Leprechaun assists with this process.
How it Works
Using a tool such as Josh Stone's routehunter, or any other process/tool that can recursively run netstat on multiple hosts, you can provide Leprechaun this output and get a visual representation of the data flow (or network connections) within the environment.
Using the command and arguments ./leprechaun.rb -f results.txt -p all, you can quickly parse the netstat results into the following graph:
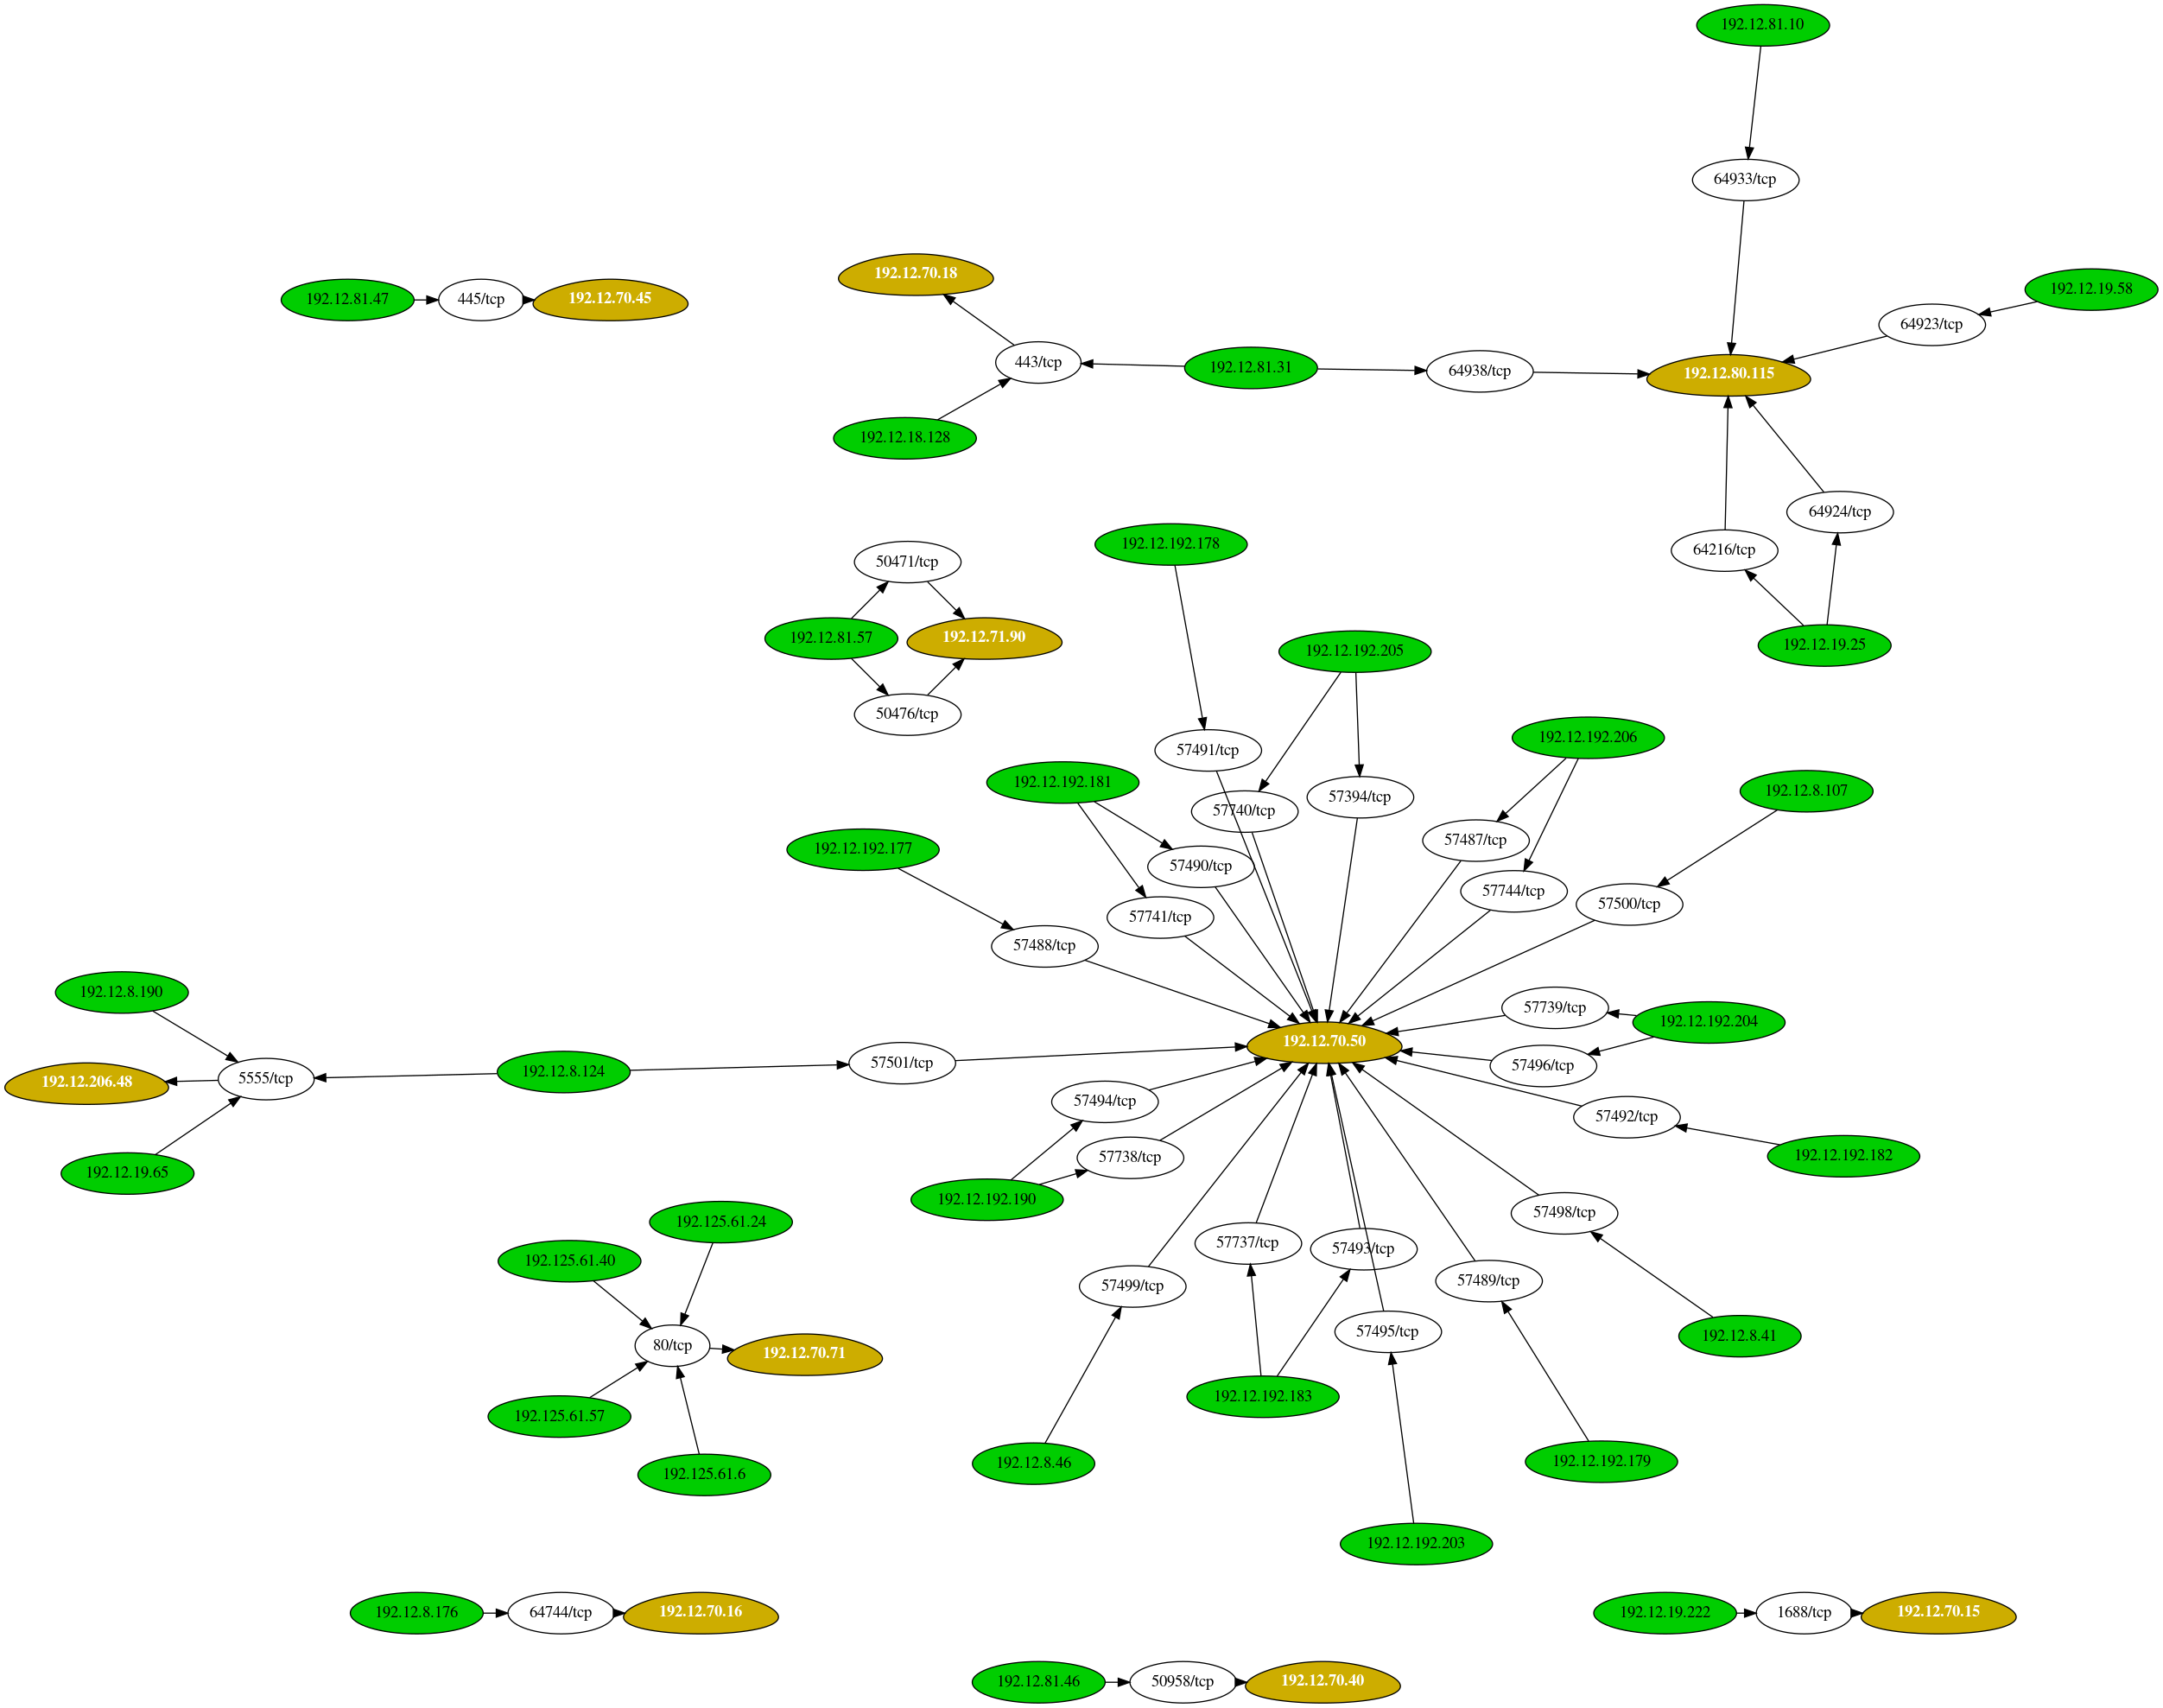
In a really large network environment, being able to quickly map out what exactly is going on can save you a lot of time. Using the output above, you can quickly (and very easily) deduce that the system residing at 192.12.70.50 is a pretty important system. Therefore, you'd want to focus your attention on this system and determine what exactly is going on here.
Furthermore, if you'd prefer a text output, you can use the same command as above and get the following results:
[root:vonahisec-kali:~/test]# ./leprechaun.rb -f results.txt -p all

 [*] Completed! Graph output file located at: ./network_diagram.png

+---------------+-----------------------------+----------------------------------+
| Server        | Number of connected clients | Highest traffic destination port |
+---------------+-----------------------------+----------------------------------+
| 192.12.70.50  | 21                          | 57488/tcp (1 clients)            |
| 192.12.80.115 | 5                           | 64216/tcp (1 clients)            |
| 192.12.70.71  | 4                           | 80/tcp (4 clients)               |
| 192.12.206.48 | 3                           | 5555/tcp (3 clients)             |
| 192.12.71.90  | 2                           | 50471/tcp (1 clients)            |
| 192.12.70.18  | 2                           | 443/tcp (2 clients)              |
| 192.12.70.45  | 1                           | 445/tcp (1 clients)              |
| 192.12.70.40  | 1                           | 50958/tcp (1 clients)            |
| 192.12.70.16  | 1                           | 64744/tcp (1 clients)            |
| 192.12.70.15  | 1                           | 1688/tcp (1 clients)             |
+---------------+-----------------------------+----------------------------------+
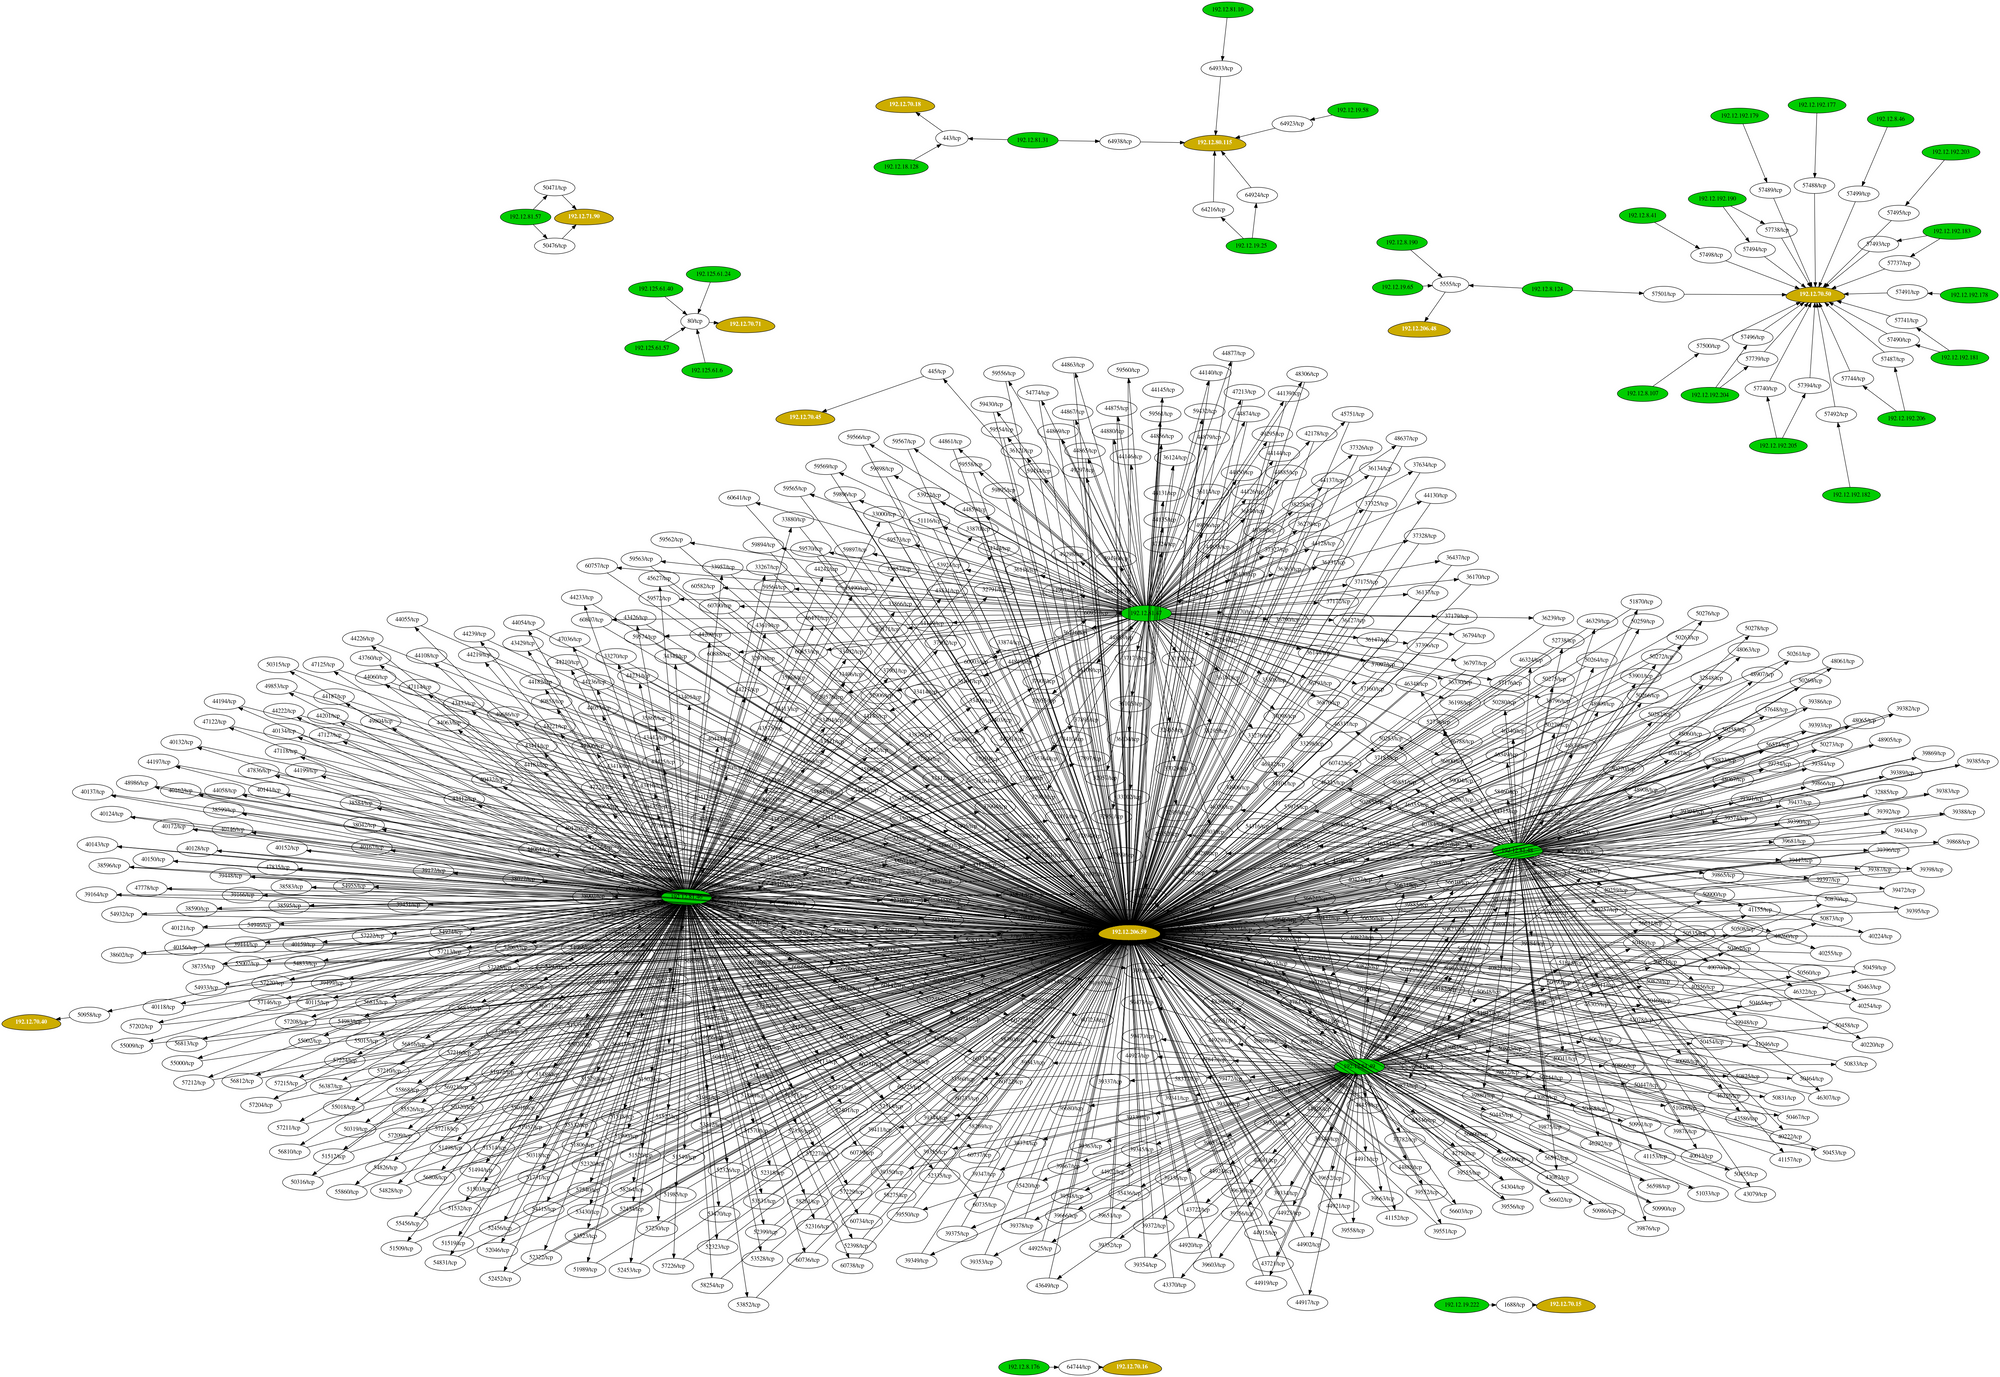
In some cases, this could get very complex depending on the network size and the amount of established connections within the environment. It could look like this:
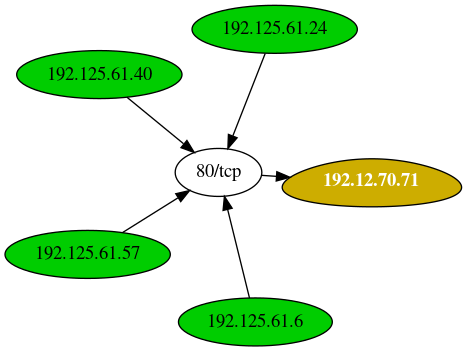
So, if you'd like just a specific port, replace all in the argument above with a specific port, such as 80, or even 80,443,8080 etc., and you get the following output and chart:
[root:vonahisec-kali:~/test]# ./leprechaun.rb -f results.txt -p 80

 [*] Completed! Graph output file located at: ./network_diagram.png

+--------------+-----------------------------+----------------------------------+
| Server       | Number of connected clients | Highest traffic destination port |
+--------------+-----------------------------+----------------------------------+
| 192.12.70.71 | 4                           | 80/tcp (4 clients)               |
+--------------+-----------------------------+----------------------------------+
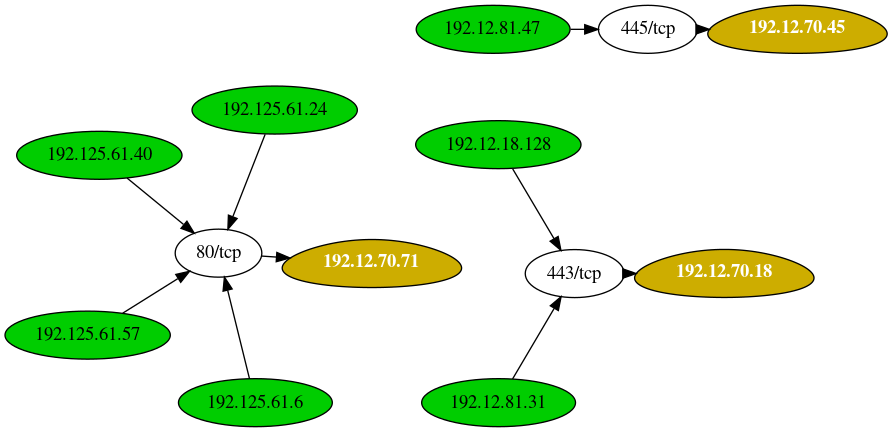
And lastly, if you're interested in just "common" ports, you can use the hardcoded list of ports or you can modify it to your own liking. Here's an example of looking at common ports.
[root:vonahisec-kali:~/Downloads/test]# ./leprechaun.rb -f netstat.txt -p common

 [*] Completed! Graph output file located at: ./network_diagram.png

+--------------+-----------------------------+----------------------------------+
| Server       | Number of connected clients | Highest traffic destination port |
+--------------+-----------------------------+----------------------------------+
| 192.12.70.71 | 4                           | 80/tcp (4 clients)               |
| 192.12.70.18 | 2                           | 443/tcp (2 clients)              |
| 192.12.70.45 | 1                           | 445/tcp (1 clients)              |
+--------------+-----------------------------+----------------------------------+
If you're curious about what a sample netstat file would look like that it would parse, it can be several lines containing the normal format you'd get from netstat, shown below (IPv4 only):
TCP    192.168.19.25:445       192.168.80.115:64216    ESTABLISHED
TCP    192.168.19.25:445       192.168.80.115:64924    ESTABLISHED
TCP    192.168.19.58:445       192.168.80.115:64923    ESTABLISHED
TCP    192.168.81.10:445       192.168.80.115:64933    ESTABLISHED
TCP    192.168.81.31:445       192.168.80.115:64938    ESTABLISHED
TCP    192.168.19.222:49319    192.168.70.15:1688      ESTABLISHED
TCP    192.168.8.176:1433      192.168.70.16:64744     ESTABLISHED
TCP    192.168.18.128:55276    192.168.70.18:443       ESTABLISHED
TCP    192.168.81.31:59387     192.168.70.18:443       ESTABLISHED
TCP    192.168.81.46:50115     192.168.70.40:50958     ESTABLISHED
TCP    192.168.81.47:63280     192.168.70.45:445       ESTABLISHED
TCP    192.168.81.47:63280     192.168.70.45:445       ESTABLISHED
TCP    192.168.81.47:63280     192.168.70.45:445       ESTABLISHED
TCP    192.168.10.177:49154    192.168.70.50:57488     ESTABLISHED
TCP    192.168.10.178:49154    192.168.70.50:57491     ESTABLISHED
TCP    192.168.10.179:49154    192.168.70.50:57489     ESTABLISHED
TCP    192.168.10.181:135      192.168.70.50:57741     ESTABLISHED
TCP    192.168.10.181:49154    192.168.70.50:57490     ESTABLISHED
Conclusion
The last thing you want to do while on-site is spend hours hunting through data, trying to learn the network. While you can sometimes ask your primary point of contact for information that may be useful, quickly learning more about the network in a short period of time may demonstrate a lot of value to your customer.
We've used similar techniques to locate important Database Management Systems in the past and eventually was able to obtain other credentials, such as Microsoft SQL Server service accounts by locating SQL clients and servers. This may also be useful for identifying other important resources, such as file servers, intranets, applications servers, and more.
Leprechaun can be obtained at the following GitHub repository: https://github.com/vonahi-security/leprechaun
Reach out to us on Twitter (@vonahisec) if you have any questions!
About Vonahi Security
Vonahi Security is a cybersecurity consulting firm that offers modern consulting services to help organizations achieve both compliance and security best practices. With over 30 years of combined industry experience in both offensive and defensive security operations, our team of certified consultants have experience working with a significant number of organizations, industries, networks, and technologies. Our service expertise includes Managed Security, Adversary Simulations, Strategy & Review, and User Education & Awareness. Vonahi Security is headquartered in Atlanta, GA. To learn more, visit www.vonahi.io
Stay Informed
